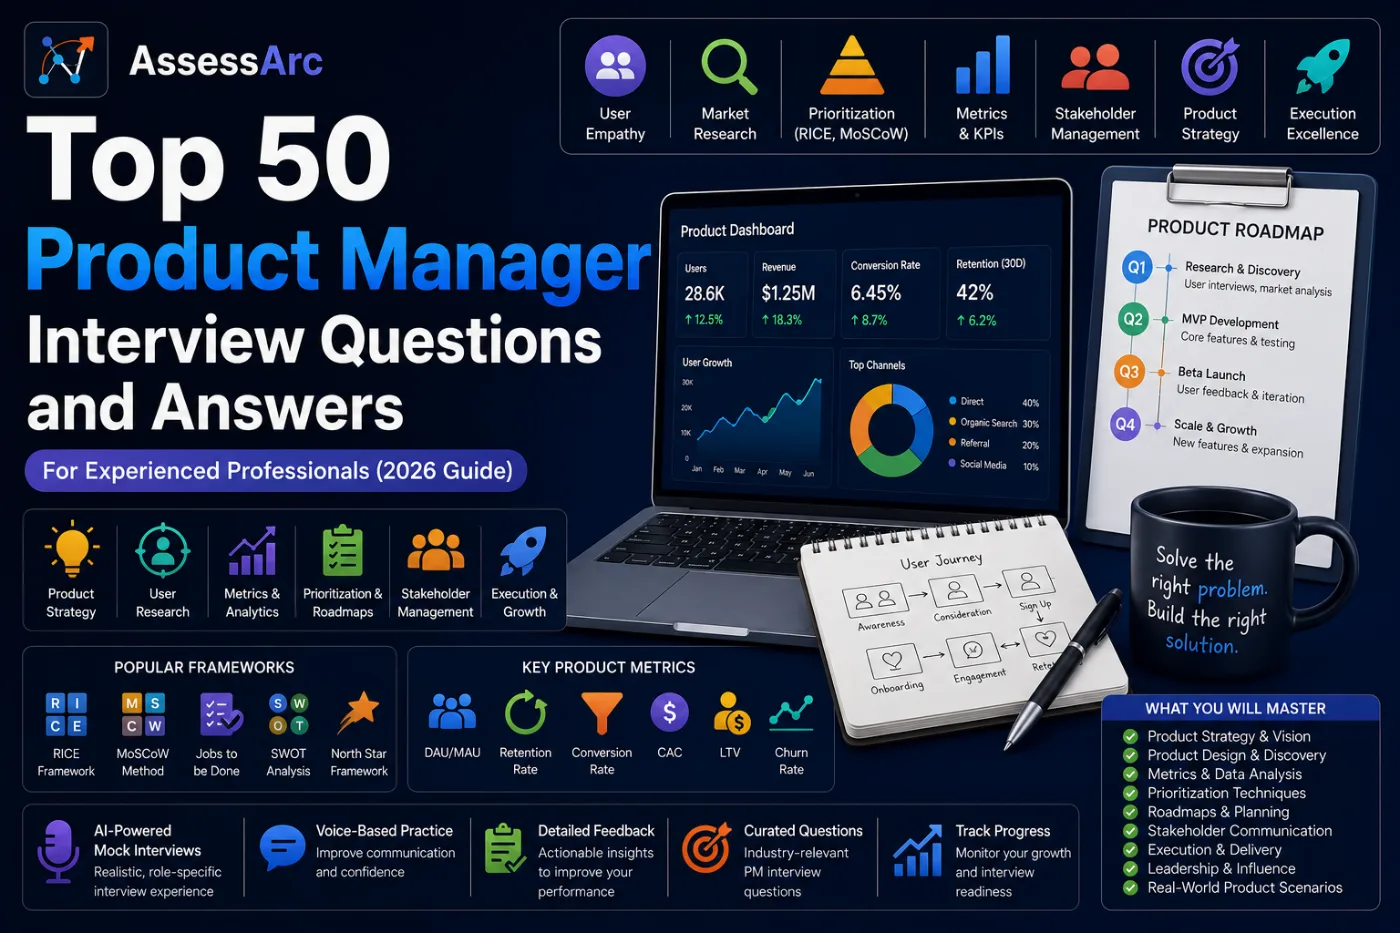
Top 50 Data Analyst Interview Questions and Answers for Experienced Professionals (2026 Guide)
Prepare for Data Analyst interviews with 50 commonly asked questions covering SQL, Excel, Power BI, Tableau, statistics, data cleaning, and business analytics.
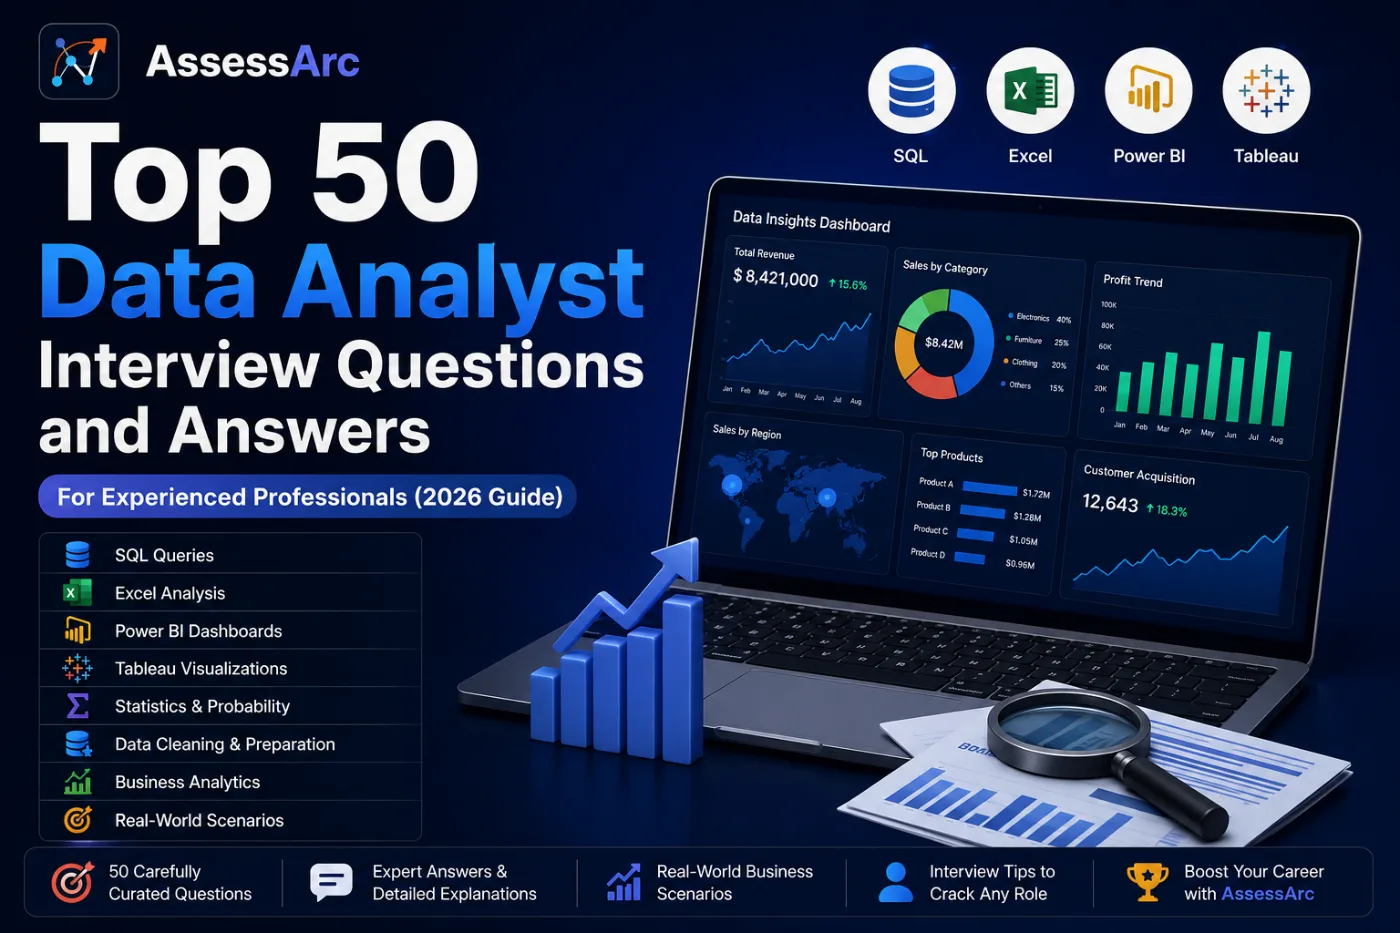
Top 50 Data Analyst Interview Questions and Answers for Experienced Professionals (2026 Guide)
Table of Contents
Data Analyst Fundamentals
SQL Interview Questions
Statistics Interview Questions
Excel Interview Questions
Power BI & Tableau Questions
Data Cleaning & Analysis Questions
Business Analytics Questions
Real-World Scenario Questions
Common Interview Mistakes
How AssessArc Helps
Conclusion
Introduction
Data Analysts play a critical role in helping organizations make data-driven decisions.
Modern Data Analysts are expected to work with:
SQL
Excel
Power BI
Tableau
Python
Statistics
Data Visualization
Business Intelligence
Whether you're applying for roles at startups, product companies, consulting firms, or large enterprises, interviewers evaluate both your technical skills and business understanding.
This guide covers the top 50 Data Analyst interview questions and answers frequently asked in interviews.
Data Analyst Fundamentals
1. Who is a Data Analyst?
Answer
A Data Analyst collects, processes, analyzes, and visualizes data to help organizations make informed business decisions.
Responsibilities include:
Data collection
Data cleaning
Reporting
Dashboard creation
Trend analysis
2. What is the Difference Between Data Analyst and Data Scientist?
Answer
Data Analyst | Data Scientist |
|---|---|
Focuses on insights | Focuses on predictions |
SQL, Excel, BI Tools | Machine Learning, AI |
Reporting | Predictive Modeling |
Business Analysis | Advanced Analytics |
3. What Are the Key Skills of a Data Analyst?
Answer
A Data Analyst should know:
SQL
Excel
Power BI
Tableau
Statistics
Data Visualization
Business Analysis
4. What is Data Analysis?
Answer
Data Analysis is the process of inspecting, cleaning, transforming, and interpreting data to extract meaningful insights.
5. What is Data Cleaning?
Answer
Data Cleaning involves identifying and fixing:
Missing values
Duplicate records
Incorrect data
Outliers
before performing analysis.
6. Why is Data Cleaning Important?
Answer
Poor data quality leads to:
Incorrect insights
Wrong decisions
Misleading reports
Clean data improves accuracy.
7. What is ETL?
Answer
ETL stands for:
Extract
Transform
Load
It is used to move and process data between systems.
8. What is KPI?
Answer
KPI (Key Performance Indicator) is a measurable metric used to evaluate business performance.
Examples:
Revenue
Conversion Rate
Customer Retention
9. What is Business Intelligence?
Answer
Business Intelligence (BI) refers to technologies and processes used to analyze business data and support decision-making.
10. What Are Common Data Analyst Tools?
Answer
Popular tools include:
SQL
Excel
Power BI
Tableau
Python
Google Sheets
SQL Interview Questions
11. What is SQL?
Answer
SQL (Structured Query Language) is used to store, retrieve, update, and analyze data in relational databases.
12. Difference Between WHERE and HAVING
Answer
WHERE | HAVING |
|---|---|
Filters Rows | Filters Groups |
Before Aggregation | After Aggregation |
13. What is a JOIN?
Answer
JOIN combines data from multiple tables.
Common types:
INNER JOIN
LEFT JOIN
RIGHT JOIN
FULL JOIN
14. Difference Between INNER JOIN and LEFT JOIN
Answer
INNER JOIN returns matching records only.
LEFT JOIN returns all records from the left table and matching records from the right table.
15. What is GROUP BY?
Answer
GROUP BY groups rows based on one or more columns.
Example:
SELECT department,
COUNT(*)
FROM employees
GROUP BY department;
16. What is an Aggregate Function?
Answer
Examples:
COUNT()
SUM()
AVG()
MAX()
MIN()
Used for calculations on groups of data.
17. What is a Subquery?
Answer
A query inside another query.
Used for complex filtering and calculations.
18. What is a Primary Key?
Answer
A Primary Key uniquely identifies each record in a table.
19. What is a Foreign Key?
Answer
A Foreign Key establishes relationships between tables.
20. Difference Between DELETE, TRUNCATE, and DROP
Answer
DELETE | TRUNCATE | DROP |
|---|---|---|
Removes Rows | Removes All Rows | Removes Table |
Can Rollback | Limited Rollback | Deletes Structure |
Statistics Interview Questions
21. What is Mean?
Answer
Mean is the average value.
Formula:
Sum of values ÷ Number of values
22. What is Median?
Answer
Median is the middle value in a sorted dataset.
23. What is Mode?
Answer
Mode is the most frequently occurring value.
24. What is Standard Deviation?
Answer
Measures data spread around the mean.
Higher value = More variability.
25. What is Variance?
Answer
Variance measures how far data points are from the average.
26. What is Correlation?
Answer
Correlation measures relationships between variables.
Range:
-1 to +1
27. Correlation vs Causation
Answer
Correlation does not imply causation.
Two variables may move together without causing each other.
28. What is Normal Distribution?
Answer
A bell-shaped distribution where most values cluster around the mean.
29. What is Hypothesis Testing?
Answer
A statistical method used to determine whether assumptions are supported by data.
30. What is a P-Value?
Answer
P-value measures statistical significance.
Common threshold:
p < 0.05
Excel Interview Questions
31. What Are VLOOKUP and HLOOKUP?
Answer
Used to search and retrieve data from tables.
32. What is XLOOKUP?
Answer
Modern replacement for VLOOKUP.
Provides more flexibility.
33. What Are Pivot Tables?
Answer
Pivot Tables summarize large datasets quickly.
Useful for:
Reporting
Aggregation
Analysis
34. What Are Conditional Formatting Rules?
Answer
Used to highlight data based on conditions.
Examples:
Top values
Duplicates
Low performance
35. What Are Common Excel Functions?
Answer
Frequently used functions:
IF
SUM
COUNT
VLOOKUP
XLOOKUP
INDEX
MATCH
Power BI & Tableau Questions
36. What is Power BI?
Answer
Power BI is Microsoft's business intelligence and visualization platform.
37. What is Tableau?
Answer
Tableau is a data visualization and dashboarding tool.
38. Power BI vs Tableau
Answer
Power BI | Tableau |
|---|---|
Microsoft Ecosystem | Strong Visualization |
Lower Cost | Advanced Dashboards |
39. What is a Dashboard?
Answer
A dashboard displays KPIs and business metrics visually.
40. What Makes a Good Dashboard?
Answer
A good dashboard should be:
Simple
Interactive
Actionable
Easy to understand
Business Analytics Questions
41. How Would You Measure Customer Retention?
Answer
Formula:
(Retained Customers / Total Customers) × 100
42. What is Customer Churn?
Answer
Customer churn refers to customers leaving a product or service.
43. How Would You Analyze a Revenue Drop?
Answer
Investigate:
Sales volume
Customer behavior
Market conditions
Product performance
44. What Metrics Would You Track for an E-commerce Business?
Answer
Examples:
Revenue
Conversion Rate
Average Order Value
Customer Retention
Churn Rate
45. How Would You Identify Top Performing Products?
Answer
Analyze:
Revenue
Units Sold
Profit Margin
Customer Reviews
Real-World Scenario Questions
46. A Dashboard Shows Sudden Revenue Decline. What Would You Do?
Answer
Steps:
Validate data accuracy
Compare historical trends
Identify affected regions
Investigate root causes
47. How Would You Handle Missing Data?
Answer
Options:
Remove records
Replace with averages
Use interpolation
Use business rules
48. How Would You Analyze Website Traffic Drop?
Answer
Check:
Traffic sources
SEO performance
Campaign changes
Technical issues
49. How Would You Present Insights to Non-Technical Stakeholders?
Answer
Use:
Simple language
Visual dashboards
Actionable recommendations
Avoid technical jargon.
50. What Are Interviewers Looking for in Data Analyst Interviews?
Answer
Interviewers evaluate:
Technical Skills
SQL
Excel
BI Tools
Analytical Thinking
Can you solve business problems?
Communication Skills
Can you explain insights clearly?
Business Understanding
Can you connect data to decisions?
Common Data Analyst Interview Mistakes
❌ Focusing only on tools
❌ Weak SQL knowledge
❌ Poor understanding of statistics
❌ Ignoring business impact
❌ Overcomplicating explanations
❌ Not preparing real-world examples
How AssessArc Helps You Prepare for Data Analyst Interviews
AssessArc helps candidates practice:
Data Analyst Interview Questions
SQL Questions
Statistics Questions
Power BI Scenarios
Business Analytics Discussions
through AI-powered voice interviews, follow-up questions, personalized feedback, and detailed performance reports.
Conclusion
Data Analysts play a crucial role in helping organizations make better decisions through data.
Mastering SQL, Excel, Power BI, Tableau, statistics, and business analytics concepts can significantly improve your interview performance.
Practice these Data Analyst interview questions regularly and explain concepts confidently to maximize your chances of landing your next Data Analyst role.